모두 모으기
파이프라이닝
우리는 어떤 추정기(estimators)는 데이터를 변환하고 어떤 추정기는 변수를 예측할 수 있음을 보았습니다. 또 우리는 결합된 추정기를 만들 수 있습니다:
from sklearn.decomposition import PCA
from sklearn.linear_model import LogisticRegression
from sklearn.pipeline import Pipeline
from sklearn.model_selection import GridSearchCV
from sklearn.preprocessing import StandardScaler

# PCA 절단(truncation)과 분류기 정규화(regularization)의 최고의 조합을 찾는
# 파이프라인(pipeline)을 정의합니다
pca = PCA()
# 입력을 정규화하기 위한 표준 스케일러(standard scaler)를 정의합니다
scaler = StandardScaler()

# 예제를 빠르게 만들기 위해 공차한계(tolerance)를 큰 값으로 설정합니다
logistic = LogisticRegression(max_iter=10000, tol=0.1)
pipe = Pipeline(steps=[("scaler", scaler), ("pca", pca), ("logistic", logistic)])

X_digits, y_digits = datasets.load_digits(return_X_y=True)
# 파이프라인의 매개변수는 '__'로 구분된 매개변수 이름으로 설정할 수 있습니다
param_grid = {
    "pca__n_components": [5, 15, 30, 45, 60],
    "logistic__C": np.logspace(-4, 4, 4),
}
search = GridSearchCV(pipe, param_grid, n_jobs=2)
search.fit(X_digits, y_digits)
print("Best parameter (CV score=%0.3f):" % search.best_score_)
print(search.best_params_)

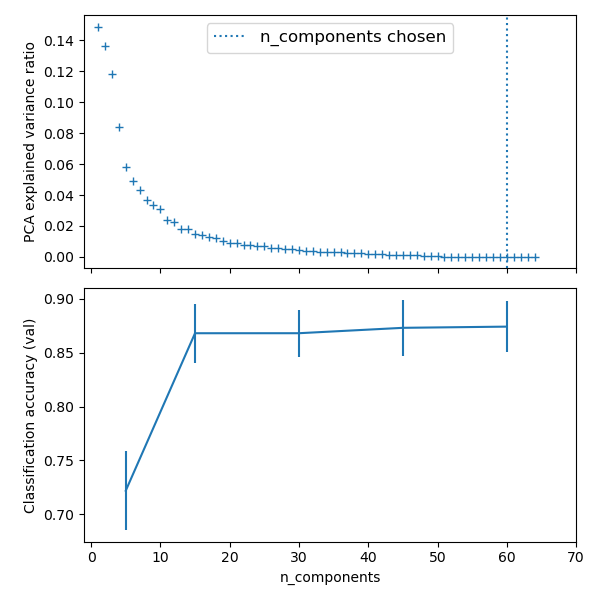
# PCA 스펙트럼(spectrum)을 플로팅(plot)합니다
pca.fit(X_digits)

fig, (ax0, ax1) = plt.subplots(nrows=2, sharex=True, figsize=(6, 6))
ax0.plot(
    np.arange(1, pca.n_components_ + 1), pca.explained_variance_ratio_, "+", linewidth=2
)
ax0.set_ylabel("PCA explained variance ratio")

ax0.axvline(
    search.best_estimator_.named_steps["pca"].n_components,
    linestyle=":",
    label="n_components chosen",
)

고유얼굴로 얼굴 인식
이 예제에서 사용한 데이터셋은 LFW로 알려진, “자연 속의 레이블된 얼굴들(Labeled Faces in the Wild)”의 전처리된 발췌본(excerpt)입니다.
http://vis-www.cs.umass.edu/lfw/lfw-funneled.tgz (233MB)
"""
===================================================
고유얼굴과 SVMs를 사용한 얼굴 인식 예제
===================================================

이 예제에서 사용한 데이터셋은 LFW_로 알려진, "자연 속의 레이블된 얼굴들
(Labeled Faces in the Wild)"의 전처리된 발췌본(excerpt)입니다:

  http://vis-www.cs.umass.edu/lfw/lfw-funneled.tgz (233MB)

.. _LFW: http://vis-www.cs.umass.edu/lfw/

"""
# %%
from time import time
import matplotlib.pyplot as plt

from sklearn.model_selection import train_test_split
from sklearn.model_selection import RandomizedSearchCV
from sklearn.datasets import fetch_lfw_people
from sklearn.metrics import classification_report
from sklearn.metrics import ConfusionMatrixDisplay
from sklearn.preprocessing import StandardScaler
from sklearn.decomposition import PCA
from sklearn.svm import SVC
from sklearn.utils.fixes import loguniform


# %%
# 디스크(disk)에 아직 없다면 데이터를 다운로드하고, 넘파이(numpy) 배열로 불러옵니다

lfw_people = fetch_lfw_people(min_faces_per_person=70, resize=0.4)

# (플로팅을 위한) 형태(shape)를 찾기 위해 이미지 배열을 들여다봅니다
n_samples, h, w = lfw_people.images.shape

# 기계 학습을 위해 2개 데이터를 직접적으로 사용합니다 (상대적인 픽셀
# 위치는 이 모델에서는 무시합니다)
X = lfw_people.data
n_features = X.shape[1]

# 예측하려는 레이블은 인물의 아이디(id)입니다
y = lfw_people.target
target_names = lfw_people.target_names
n_classes = target_names.shape[0]

print("Total dataset size:")
print("n_samples: %d" % n_samples)
print("n_features: %d" % n_features)
print("n_classes: %d" % n_classes)


# %%
# 훈련 세트와 테스트 세트로 분할하며 25%의 데이터를 테스트를 위해 유지합니다

X_train, X_test, y_train, y_test = train_test_split(
    X, y, test_size=0.25, random_state=42
)

scaler = StandardScaler()
X_train = scaler.fit_transform(X_train)
X_test = scaler.transform(X_test)

# %%
# (레이블 없는 데이터셋으로 간주해) 얼굴 데이터셋에서 PCA(고유얼굴)를
# 계산합니다: 비지도 특성 추출(extraction) / 차원 감소(dimensionality reduction)

n_components = 150

print(
    "Extracting the top %d eigenfaces from %d faces" % (n_components, X_train.shape[0])
)
t0 = time()
pca = PCA(n_components=n_components, svd_solver="randomized", whiten=True).fit(X_train)
print("done in %0.3fs" % (time() - t0))

eigenfaces = pca.components_.reshape((n_components, h, w))

print("Projecting the input data on the eigenfaces orthonormal basis")
t0 = time()
X_train_pca = pca.transform(X_train)
X_test_pca = pca.transform(X_test)
print("done in %0.3fs" % (time() - t0))


# %%
# SVM 분류 모델을 훈련시킵니다

print("Fitting the classifier to the training set")
t0 = time()
param_grid = {
    "C": loguniform(1e3, 1e5),
    "gamma": loguniform(1e-4, 1e-1),
}
clf = RandomizedSearchCV(
    SVC(kernel="rbf", class_weight="balanced"), param_grid, n_iter=10
)
clf = clf.fit(X_train_pca, y_train)
print("done in %0.3fs" % (time() - t0))
print("Best estimator found by grid search:")
print(clf.best_estimator_)


# %%
# 테스트 세트에 대한 모델 품질의 양적(quantitative) 평가

print("Predicting people's names on the test set")
t0 = time()
y_pred = clf.predict(X_test_pca)
print("done in %0.3fs" % (time() - t0))

print(classification_report(y_test, y_pred, target_names=target_names))
ConfusionMatrixDisplay.from_estimator(
    clf, X_test_pca, y_test, display_labels=target_names, xticks_rotation="vertical"
)
plt.tight_layout()
plt.show()


# %%
# 맷플롯립(matplotlib)을 이용한 모델 품질의 양적(quantitative) 평가


def plot_gallery(images, titles, h, w, n_row=3, n_col=4):
    """Helper function to plot a gallery of portraits"""
    plt.figure(figsize=(1.8 * n_col, 2.4 * n_row))
    plt.subplots_adjust(bottom=0, left=0.01, right=0.99, top=0.90, hspace=0.35)
    for i in range(n_row * n_col):
        plt.subplot(n_row, n_col, i + 1)
        plt.imshow(images[i].reshape((h, w)), cmap=plt.cm.gray)
        plt.title(titles[i], size=12)
        plt.xticks(())
        plt.yticks(())


# %%
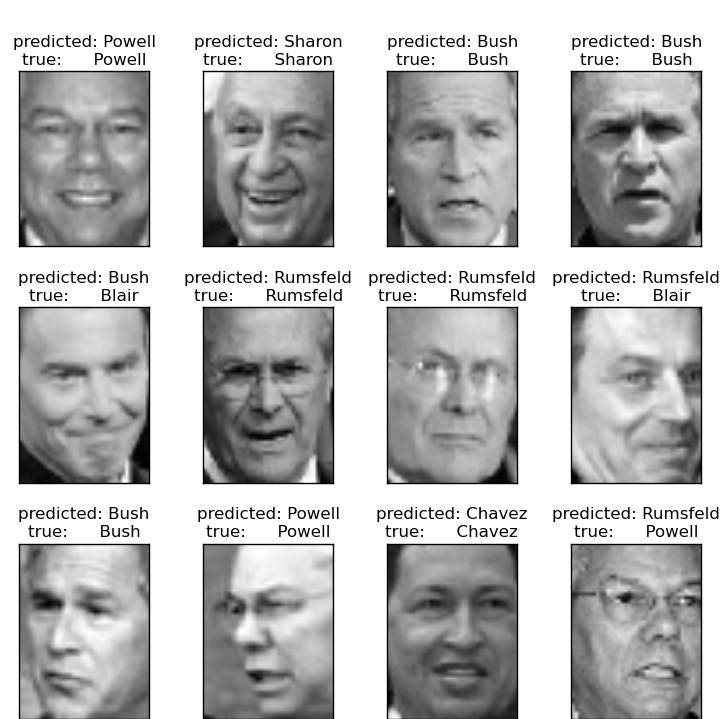
# 테스트 세트 부분에 대한 예측 결과를 플로팅합니다


def title(y_pred, y_test, target_names, i):
    pred_name = target_names[y_pred[i]].rsplit(" ", 1)[-1]
    true_name = target_names[y_test[i]].rsplit(" ", 1)[-1]
    return "predicted: %s\ntrue:      %s" % (pred_name, true_name)


prediction_titles = [
    title(y_pred, y_test, target_names, i) for i in range(y_pred.shape[0])
]

plot_gallery(X_test, prediction_titles, h, w)
# %%
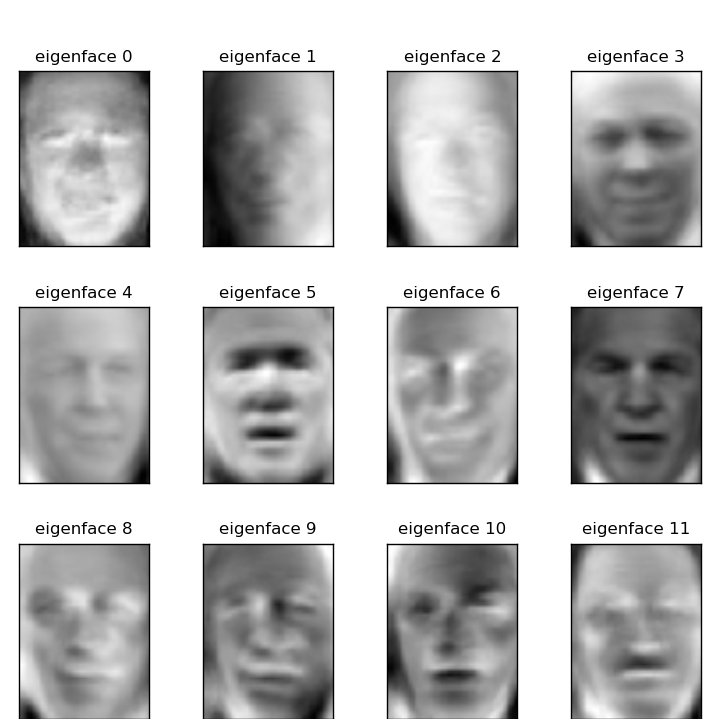
# 가장 유의한(significative) 고유얼굴의 화랑(gallery)을 플로팅합니다

eigenface_titles = ["eigenface %d" % i for i in range(eigenfaces.shape[0])]
plot_gallery(eigenfaces, eigenface_titles, h, w)

plt.show()

# %%
# 얼굴 인식 문제는 합성곱 신경망(convolutional neural networks)을 훈련시키면
# 훨씬 더 효과적으로 해결할 수 있지만 이 모델 군은 사이킷런 라이브러리의 범주
# 바깥에 있습니다. 이러한 모델의 구현에 관심이 있는 독자분들은 대신에
# 파이토치(pytorch)나 텐서플로우(tensorflow)를 사용해보세요.

예측

고유얼굴(eigenfaces)
데이터셋에서 가장 많이 표현되는 상위 5명의 사람들에 대한 예상되는 결과:
                   precision    recall  f1-score   support

Gerhard_Schroeder       0.91      0.75      0.82        28
  Donald_Rumsfeld       0.84      0.82      0.83        33
       Tony_Blair       0.65      0.82      0.73        34
     Colin_Powell       0.78      0.88      0.83        58
    George_W_Bush       0.93      0.86      0.90       129

      avg / total       0.86      0.84      0.85       282
열린 문제: 주식 시장 구조
주어진 시간 프레임(time frame)에서 구글(Google)의 주가 변동(the variation in stock prices)을 예측할 수 있을까요?